
Api Holdings Limited (PharmEasy)
Pharmaceuticals
₹5.95
0.00%
Price updated: 19 Nov 2026
Api Holdings Limited (PharmEasy)'s indicative unlisted share price is ₹5.95 as of 19 Nov 2026.
Indicative Price History
₹5.95
▲ ₹0 (+1.19%) 1Y
As of 19 Nov 2026
1Y
H
₹9.15
L
₹4.75
Range Return
+1.19%
Trend
Uptrend
Month-end price history
| Month | Price (₹) |
|---|---|
| 5.75 | |
| 5.85 | |
| 5.80 | |
| 5.70 | |
| 5.50 | |
| 5.20 | |
| 5.00 | |
| 4.85 | |
| 5.90 | |
| 6.55 | |
| 6.18 | |
| 5.95 |
CIN
U60100MH2019PLC323444
Market Cap (FY )
₹22.07 Cr
Revenue (FY )
₹5,980.03 Cr
EBITDA (FY )
₹-553.44 Cr
PAT (FY )
₹-1,580.54 Cr
EBITDA Margin (FY )
-9.3%
PAT Margin (FY )
-26.4%
ROE (FY )
—
Debt / Equity (FY )
0.68
Net Worth (FY )
₹3,003.89 Cr
About Company
Registered Name : Axelia Solutions Private Limited
Industry
Pharmaceuticals
Parent Company
Api Holdings Limited
Financial Highlights
Revenue (₹ Cr)
PAT (₹ Cr)
P&L (Consolidated)
| ₹ Cr | FY25 | FY24 | FY23 | FY22 | FY21 |
|---|---|---|---|---|---|
| Revenue | 5,980.03 | 5,758.94 | 6,699.77 | 5,781.00 | 2,360.66 |
| Other Income | 107.87 | 94.66 | 55.83 | 52.18 | 25.39 |
| EBITDA | -553.44 | -551.99 | -1,365.26 | -2,293.54 | -543.93 |
| Depreciation | 168.98 | 215.95 | 243.44 | 158.79 | 32.90 |
| EBIT | -722.42 | -767.94 | -1,608.70 | -2,452.32 | -576.84 |
| Finance Costs | 506.11 | 727.92 | 665.54 | 258.26 | 43.43 |
| Tax | 55.50 | 11.54 | 15.21 | 21.73 | 21.07 |
| PAT | -1,580.54 | -2,534.39 | -5,211.44 | -3,993.16 | -641.34 |
| EPS | -1.05 | -3.02 | -8.51 | -7.28 | -2.67 |
Shareholding Pattern
Bodies Corporate
71.09%
Others
17.24%
Directors or Relatives of Directors
11.58%
Other Top Fifty Shareholders
0.1%
Annual Report FY2026
Annual Report · FY2026
Annual Report FY2025
Annual Report · FY2025
Annual Report FY2024
Annual Report · FY2024
PharmEasy One Pager
One Pager
PharmEasy One Pager
One Pager
Business Standard
Business Standard
PharmEasy veterans raise ₹63 cr for home and kitchen startup Chapter Home - Business Standard
MarkHub24
MarkHub24
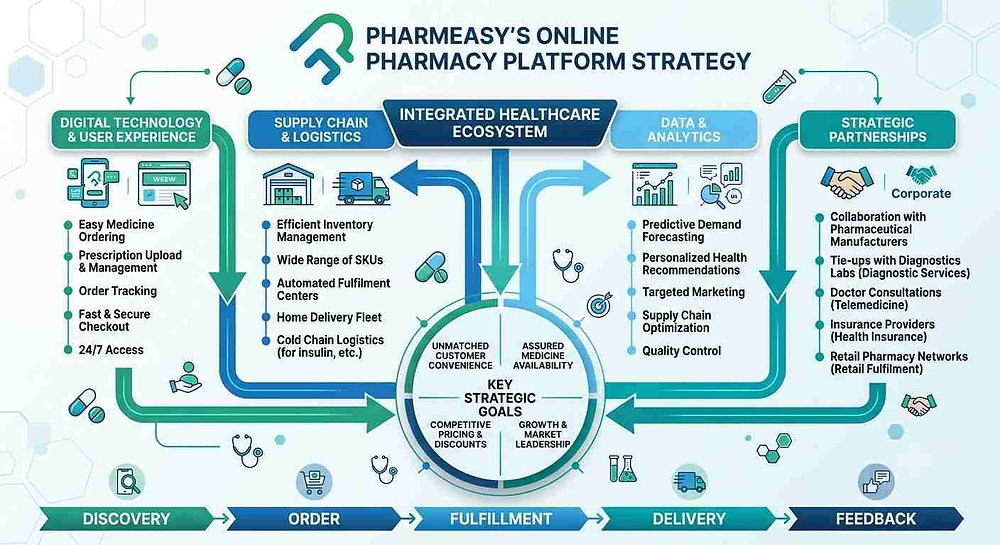
PharmEasy’s Online Pharmacy Platform Strategy - MarkHub24

API Holdings' ₹347 Cr Share Swap: The Quiet Step Before an IPO — or a Thyrocare Reverse Merger - LinkedIn
MediaNama
MediaNama
PharmEasy parent trims FY26 loss to Rs 520 crore on shift to high-margin businesses - MediaNama
Kalkine India
Kalkine India
PharmEasy Eyes an IPO Comeback After Its Parent Clears Debt: What Has Changed Since the Last Attempt - Kalkine India
Moneycontrol.com
Moneycontrol.com
PharmEasy eyes IPO comeback after Claypond, Temasek, TPG-backed parent clears debt - Moneycontrol.com

PharmEasy eyes IPO comeback as TPG-backed parent turns debt-free- Moneycontrol.com - LinkedIn

Indian Startup News
Indian Startup News
PharmEasy-owned Thyrocare approves Rs 141.4 crore sale of Nueclear Healthcare to Trovera - Indian Startup News
Zee Business
Zee Business
After NSE IPO, these unlisted stocks are now in focus - PharmEasy, Zepto, Big Basket & more - Zee Business

linkedin.com
linkedin.com
🚀 ₹5.80 → ₹9: What’s Driving API Holdings’ Sudden Rally? - linkedin.com