

Merino Industries Limited
BFSI
₹2,250.00
0.00%
Price updated: 19 Nov 2026
Merino Industries Limited's indicative unlisted share price is ₹2,250.00 as of 19 Nov 2026.
Indicative Price History
₹2,250.00
▼ ₹750 (-25.00%) 1Y
As of 19 Nov 2026
1Y
H
₹3,000.00
L
₹2,250.00
Range Return
-25.00%
Trend
Downtrend
Month-end price history
| Month | Price (₹) |
|---|---|
| 3000.00 | |
| 2750.00 | |
| 2750.00 | |
| 2750.00 | |
| 2600.00 | |
| 2600.00 | |
| 2500.00 | |
| 2500.00 | |
| 2500.00 | |
| 2500.00 | |
| 2250.00 | |
| 2250.00 |
CIN
U51909WB1965PLC026556
Market Cap (FY 25)
₹2,333.16 Cr
Revenue (FY 25)
₹2,301.39 Cr
EBITDA (FY 25)
₹159.09 Cr
PAT (FY 25)
₹-7.32 Cr
EBITDA Margin (FY 25)
6.8%
PAT Margin (FY 25)
-0.3%
ROE (FY 25)
-0.5%
Debt / Equity (FY 25)
0.52
Net Worth (FY 25)
₹1,356.98 Cr
About Company
Merino Industries Limited is a non-government company that was incorporated on July 29, 1965. The company is registered in the Kolkata (West Bengal) Registrar Office. Merino Industries Ltd. specializes in manufacturing and marketing interior solutions for a wide range of applications, including homes, offices, commercial spaces, and public areas.Merino Industries Ltd. offers a diverse range of interior solutions. Their journey Read more
Industry
BFSI
Status
Private Company - Operating
Parent Company
Merino Industries Ltd
Financial Highlights
Revenue (₹ Cr)
PAT (₹ Cr)
P&L (standalone)
| ₹ Cr | FY25 | FY24 | FY23 | FY22 | FY21 |
|---|---|---|---|---|---|
| Revenue | 2,301.39 | 2,251.83 | 2,175.50 | 1,743.59 | 1,296.88 |
| Other Income | 53.59 | 57.29 | 29.91 | 48.54 | 41.98 |
| Total Expenses | 2,195.89 | 2,045.39 | 1,935.79 | 1,540.96 | 1,087.08 |
| EBITDA | 159.09 | 263.73 | 269.62 | 251.17 | 251.78 |
| Depreciation | 128.07 | 73.87 | 66.98 | 63.58 | 56.69 |
| EBIT | 31.02 | 189.86 | 202.64 | 187.60 | 195.09 |
| Finance Costs | 57.87 | 26.38 | 28.54 | 13.20 | 18.17 |
| PBT | -26.86 | 163.48 | 174.10 | 174.40 | 176.92 |
| Tax | -19.53 | 41.94 | 56.46 | 43.03 | 45.06 |
| PAT | -7.32 | 121.54 | 117.65 | 131.37 | 131.86 |
| EPS | N/A | N/A | N/A | N/A | 117.95 |
Shareholding Pattern
Directors or Relative of Directors
98.71%
Bodies Corporate
0.9%
Others
0.4%
Annual Report FY2025
Annual Report · FY2025
Annual Report FY2024
Annual Report · FY2024
Annual Report FY2023
Annual Report · FY2023
India CSR
India CSR
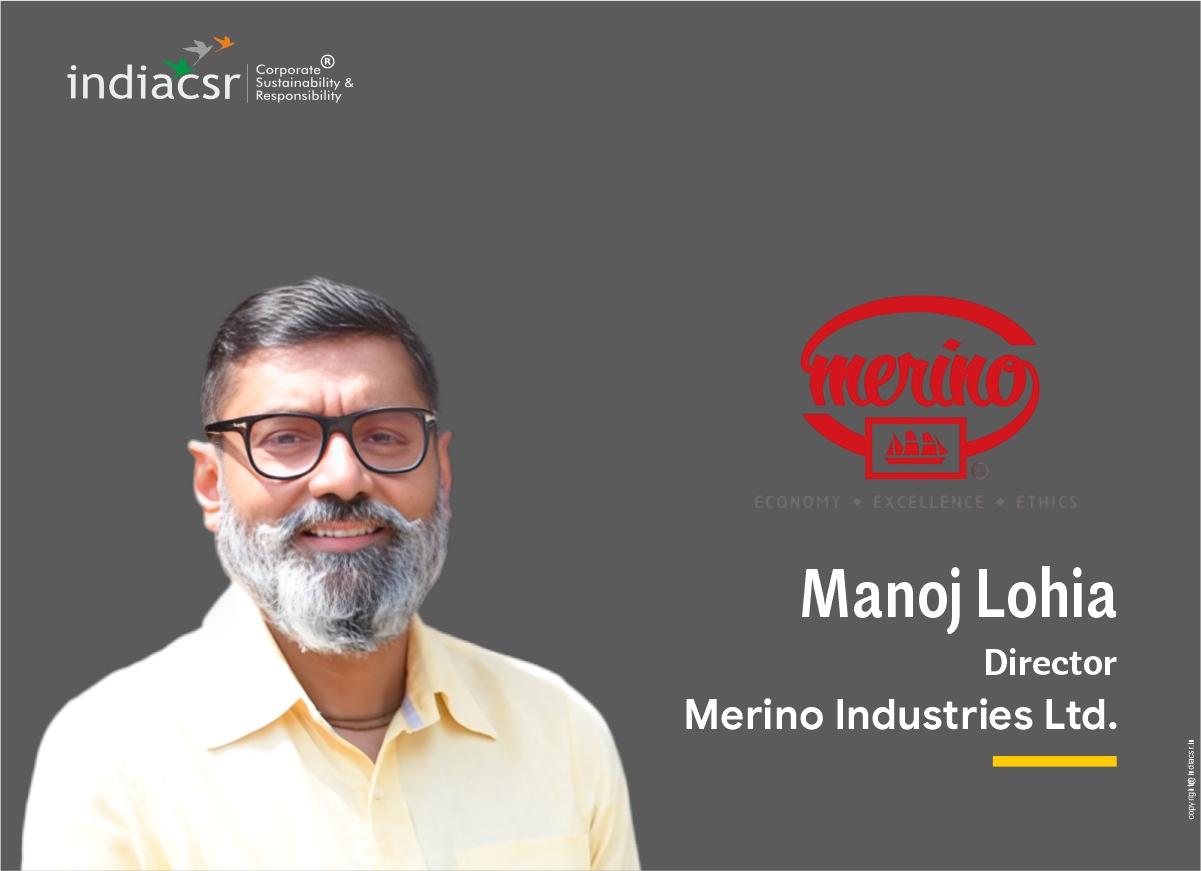
Universal Weal Through Trade: Manoj Lohia on Merino’s CSR and Sustainability Journey - India CSR
Business Standard
Business Standard
Merino Expands Studio Network to 70+ cities with 250 outlet Across India, Bringing Full-Size Laminate Experience Closer to Consumers - Business Standard

Big News Network.com
Big News Network.com
Merino Expands Studio Network to 70+ cities with 250 outlet Across India, Bringing Full-Size Laminate Experience Closer to Consumers - Big News Network.com

SMEStreet
SMEStreet
Merino Launches Digital Campaign Across OTT and Social Media - SMEStreet

afaqs!
afaqs!
Merino Laminates turns small samples into a big design question - afaqs!

Adgully
Adgully
New Studio Merino News and Updates - Adgully
SolarQuarter
SolarQuarter
HERC Resolves Merino Industries' Power Disruption Issues - SolarQuarter
Business Standard
Business Standard
Merino Showcases New Material Innovations and Gives a First Look of Prakriti at MATECIA 2026 - Business Standard
Revelio Labs
Revelio Labs
Techfab India Industries Number of Employees 2026 | Employee Count & Headcount Data - Revelio Labs
Revelio Labs
Revelio Labs
Greenlam Industries Number of Employees 2026 | Employee Count & Headcount Data - Revelio Labs