

Nayara Energy Limited
Oil & Gas
₹1,100.00
0.00%
Price updated: 19 Nov 2026
Nayara Energy Limited's indicative unlisted share price is ₹1,100.00 as of 19 Nov 2026.
Indicative Price History
₹1,100.00
▼ ₹155 (-12.35%) 1Y
As of 19 Nov 2026
1Y
H
₹1,300.00
L
₹1,010.00
Range Return
-12.35%
Trend
Downtrend
Month-end price history
| Month | Price (₹) |
|---|---|
| 1290.00 | |
| 1300.00 | |
| 1175.00 | |
| 1010.00 | |
| 1195.00 | |
| 1190.00 | |
| 1060.00 | |
| 1090.80 | |
| 1110.00 | |
| 1100.00 | |
| 1100.00 | |
| 1100.00 |
CIN
U11100GJ1989PLC032116
Market Cap (FY 25)
₹1,70,773.59 Cr
Revenue (FY 25)
₹1,49,473.5 Cr
EBITDA (FY 25)
₹12,243.6 Cr
PAT (FY 25)
₹6,061.3 Cr
EBITDA Margin (FY 25)
8.1%
PAT Margin (FY 25)
4%
ROE (FY 25)
12.1%
Debt / Equity (FY 25)
0.25
Net Worth (FY 25)
₹50,076.2 Cr
About Company
Nayara Energy Ltd. (formerly known as Essar Oil Ltd.) is engaged in the exploration and production of oil and natural gas, refining of crude oil, and marketing of petroleum products. It is into the business of exploration and production of oil and refining and marketing. The firm owns refinery with a capacity of 20 million metric tonnes per annum (MMTPA), Read more
Industry
Oil & Gas
Status
Private Company - Operating
Parent Company
Nayara Energy Limited
Financial Highlights
Revenue (₹ Cr)
PAT (₹ Cr)
P&L (standalone)
| ₹ Cr | FY25 | FY24 | FY23 | FY22 | FY21 |
|---|---|---|---|---|---|
| Revenue | 1,49,473.50 | 1,54,629.30 | 1,37,821.30 | 1,19,689.40 | 87,500.60 |
| Other Income | 1,107.10 | 931.60 | 750.20 | 313.40 | 1,055.50 |
| Total Expenses | 1,38,337.00 | 1,35,313.10 | 1,20,260.30 | 1,14,935.30 | 84,828.00 |
| EBITDA | 12,243.60 | 20,247.80 | 18,311.20 | 5,067.50 | 3,728.10 |
| Depreciation | 2,121.30 | 1,991.30 | 3,394.90 | 1,935.30 | 1,918.30 |
| EBIT | 10,122.30 | 18,256.50 | 14,916.30 | 3,132.20 | 1,809.80 |
| Finance Costs | 1,690.80 | 2,142.30 | 2,161.90 | 1,783.20 | 2,085.30 |
| PBT | 8,431.50 | 16,114.20 | 12,754.40 | 1,349.00 | -275.50 |
| Tax | 2,370.20 | 4,029.00 | 3,162.80 | 319.10 | -742.00 |
| PAT | 6,061.30 | 12,085.20 | 9,591.60 | 1,029.90 | 466.50 |
| EPS | 40.66 | 81.08 | 64.35 | 6.91 | 3.13 |
Shareholding Pattern
Rosneft
49.13%
Kesani Enterprise Company Ltd (via GDS)
31.92%
Kesani Enterprise Company Ltd (direct)
17.21%
Others
1.74%
Annual Report FY2025
Annual Report · FY2025
Annual Report FY2024
Annual Report · FY2024
Annual Report FY2023
Annual Report · FY2023
Annual Report FY2022
Annual Report · FY2022
Essar_Oil One Pager
One Pager
Nayara Energy Limited One Pager
One Pager

TradingView
TradingView
Weekly Recap: XETRA share buybacks and appeal over Nayara Energy support - TradingView

Livemint
Livemint
SAP India challenges order to restore software services to Nayara Energy - Livemint
Business Standard
Business Standard
Diesel boom lifts Reliance and Nayara, leaves state-run OMCs bleeding - Business Standard
Business Standard
Business Standard
Nayara Energy increases petrol price by ₹5 per litre, diesel by ₹3 - Business Standard
Moneycontrol.com
Moneycontrol.com
Nayara Energy hikes petrol by Rs 5, diesel by Rs 3 - Moneycontrol.com
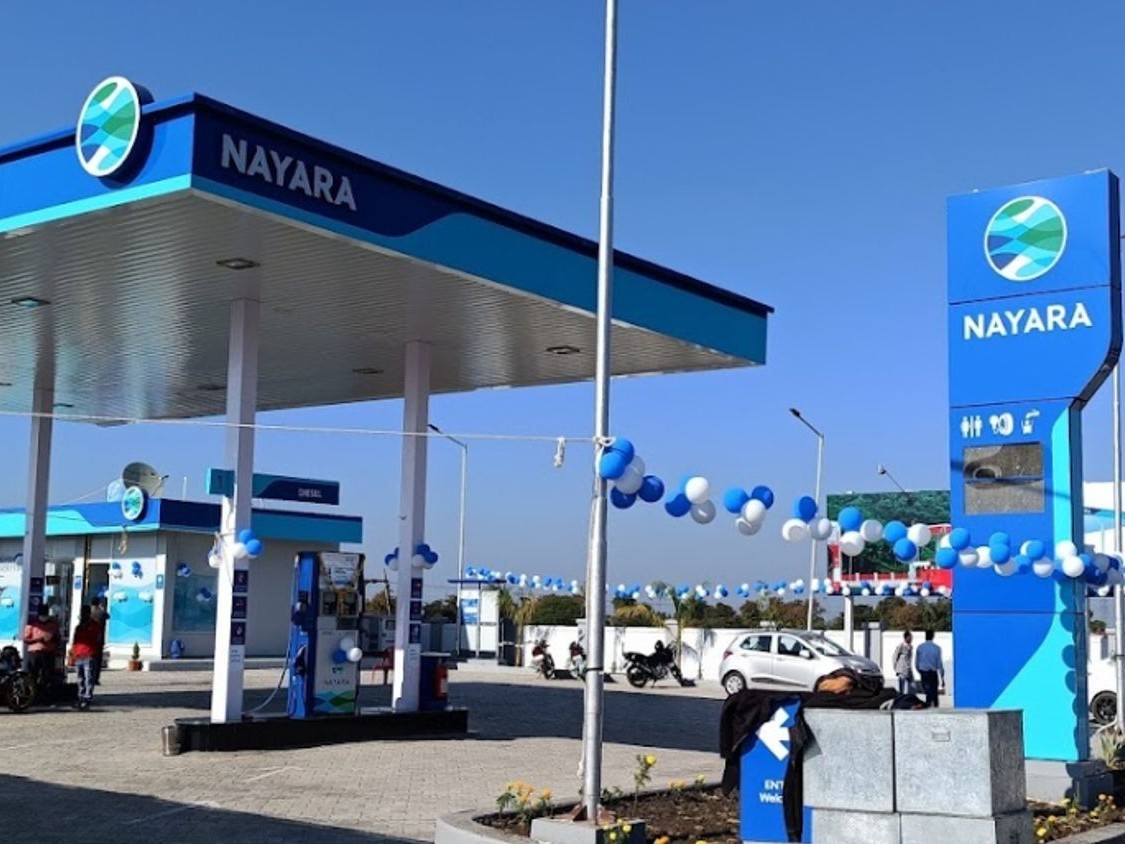
Bhaskar English
Bhaskar English
Petrol up ₹5, diesel ₹3 in Rajasthan: Nayara raises prices; govt oil firms keep rates unchanged - Bhaskar English
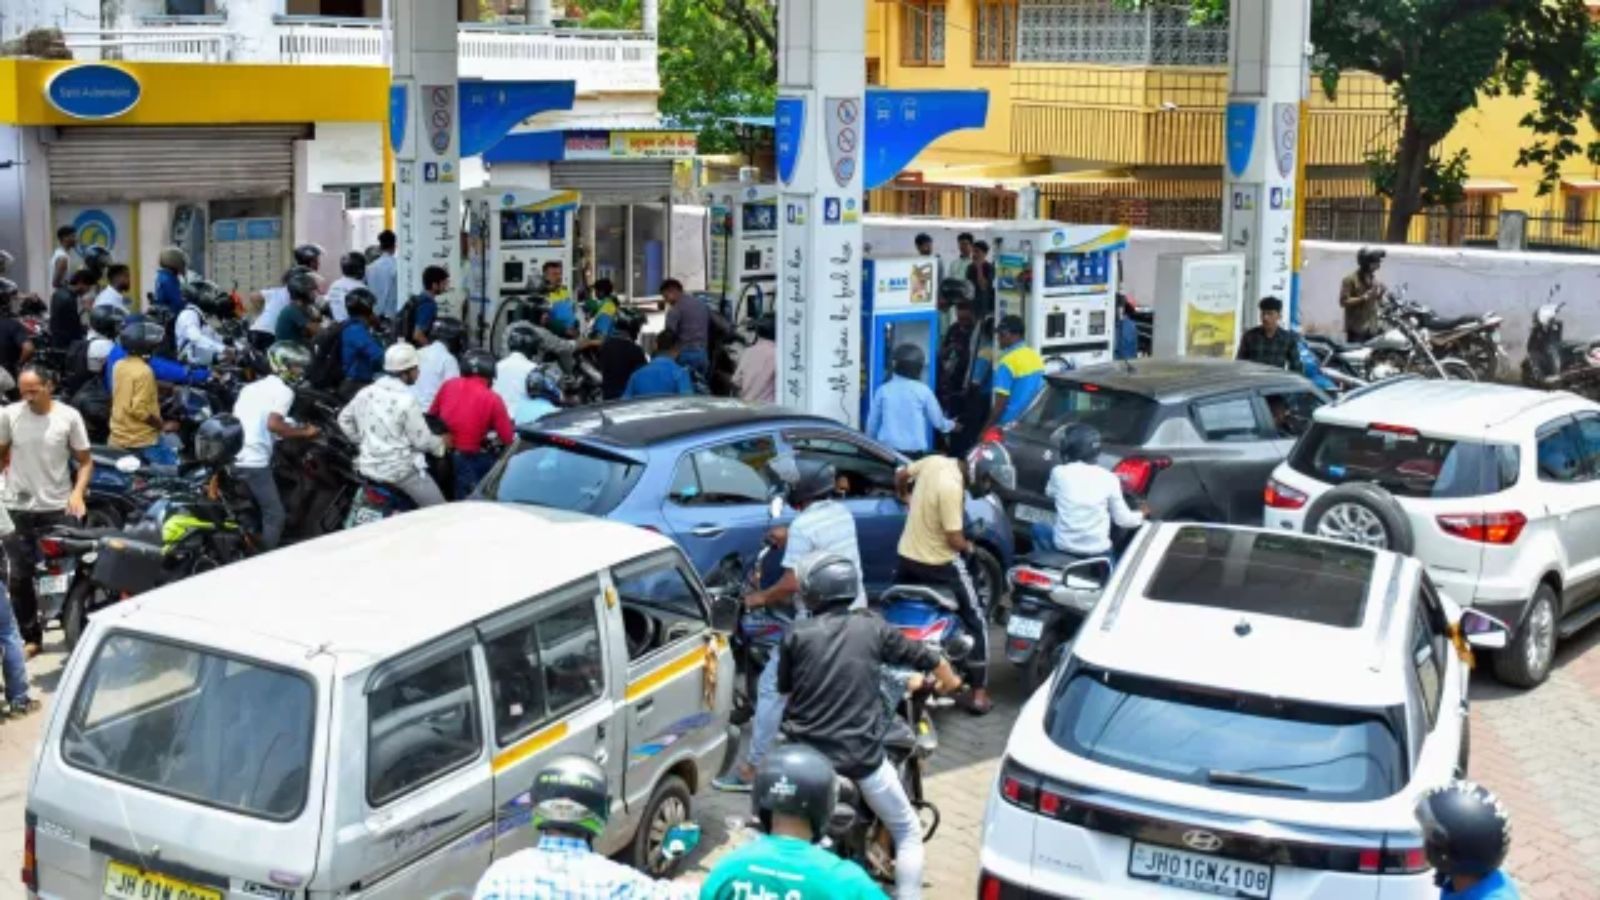
The Indian Express
The Indian Express
Capping fuel sales at pumps unacceptable, govt to tell private fuel retailers Jio-bp, Nayara - The Indian Express
Business Standard
Business Standard
No fuel supply restrictions imposed across retail network: Nayara Energy - Business Standard
Business Standard
Business Standard
Jio-bp, Nayara cap diesel sales as industrial buyers seek cheaper fuel - Business Standard
TradingView
TradingView
Weekly Recap: ITOCHU agent test and SAP India halts Nayara Energy - TradingView